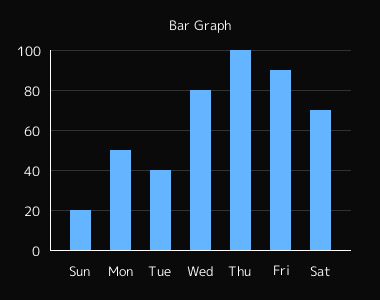
前回作ったレーダーチャートにひき続いて今回は棒グラフを作ってみます。
配列で与えられた値とラベルをもとに棒グラフを描画します。
<?php
$max	 = 100;	//上限
$step	 = 20;	//目盛の刻み

//値
$values = array(20, 50, 40, 80, 100, 90, 70);

//ラベル
$labels = array('Sun', 'Mon', 'Tue', 'Wed', 'Thu', 'Fri', 'Sat');
$label_rotate = false;

$title = "Bar Graph";

$width	 = 300;
$height	 = 200;
$bar_width = 20;
$margin_top		 = 50;
$margin_right	 = 30;
$margin_bottom	 = 50;
$margin_left	 = 50;

//フォント
$font = "migmix-1p-regular.ttf";
$font_size = 10;

$image = imagecreate($width + $margin_left + $margin_right, $height + $margin_top + $margin_bottom);

$org_x = $margin_left;
$org_y = $height + $margin_top;

//色
$bg_color   = imagecolorallocate($image, 10, 10, 10);		//背景
$line_color = imagecolorallocate($image, 255, 255, 255);	//線
$bar_color  = imagecolorallocate($image, 100, 180, 255);
$grid_color = imagecolorallocate($image, 50, 50, 50);		//
$font_color = imagecolorallocate($image, 255, 160, 200);
$grid_spacing = $height / $max * $step;

imagefill($image, 0, 0, $bg_color);

for($i=0;$i<=floor($max / $step);$i++){
	if($i !== 0) imageline($image, $org_x, $org_y - $grid_spacing * $i, $org_x + $width, $org_y - $grid_spacing * $i, $grid_color);

	$text = $i * $step;
	$box = imagettfbbox($font_size, 0, $font, $text);
	$text_width = $box[2] - $box[6];
	$text_height = $box[3] - $box[7];

	$text_x = $org_x - $font_size;
	$text_y = $org_y - $grid_spacing * $i;
	imagettftext($image, $font_size, 0, (-1 * $text_width) + $text_x, ($text_height / 2) + $text_y, $line_color, $font, $text);
}

$count = count($values);
$bar_spacing = floor( ($width - $bar_width) / $count);

for($i=0;$i<$count;$i++){
	$bar_x = $org_x + $bar_spacing * ($i + 1) - ($bar_spacing / 2);
	$bar_y = $org_y - $height * $values[$i] / $max;

	imagefilledrectangle($image, $bar_x, $org_y, $bar_x + $bar_width, $bar_y, $bar_color);

	$text = $labels[$i];
	$box = imagettfbbox($font_size, 0, $font, $text);
	$text_width = $box[2] - $box[6];
	$text_height = $box[3] - $box[7];

	if($label_rotate){
		$text_x = round(($text_height / 2) + ($bar_width / 2)) + $bar_x;
		$text_y = $text_width + $org_y + $font_size;
		imagettftext($image, $font_size, 90, $text_x, $text_y, $line_color, $font, $text);
	} else {
		$text_x = round((-1 * $text_width / 2) + ($bar_width / 2)) + $bar_x;
		$text_y = ($text_height / 2) + $org_y + $font_size * 2;
		imagettftext($image, $font_size, 0, $text_x, $text_y, $line_color, $font, $text);
	}
}

imageline($image, $org_x, $org_y, $org_x, $margin_top, $line_color);
imageline($image, $org_x, $org_y, $org_x + $width, $org_y, $line_color);

$box = imagettfbbox($font_size, 0, $font, $title);
$text_width	 = $box[2] - $box[6];
$text_height = $box[3] - $box[7];
$text_x = $org_x + $width / 2 - ($text_width / 2);
$text_y = $org_y - $height - $font_size * 2;
imagettftext($image, $font_size, 0, $text_x, $text_y, $line_color, $font, $title);

header("Content-type: image/png");
imagepng($image);

imagedestroy($image);
今回もフォントには MigMix を用いました。
同じディレクトリにアップロードして下さい。
MigMix フォント
http://mix-mplus-ipa.sourceforge.jp/
棒グラフの間隔が狭くてラベルを表示する場所が足りない場合は $label_rotate を true にすることで、文字を縦にすることができるようにしました。
グラフ領域の上下左右の余白は margin として設定できます。ラベルや目盛を表示できるように余白を確保して下さい。
Similar Posts:
- [PHP]GDで折れ線グラフを描画する(改訂版)
- [PHP]レーダーチャート(クモの巣グラフ)をGDで描画する
- [PHP]3次スプライン曲線を使ったスプライン補間
- [PHP]中心から角度を指定して線を引く(座標の回転)
- [PHP]円グラフを表示する(GD)
- [PHP]GDでアンチエイリアスのかかった綺麗な楕円を描く
- [PHP]マスク画像で写真を好きな形に切り抜く(クリッピングマスク)
- [PHP]料金表のようなものをテキストだけで表現する
