[PHP]3次スプライン曲線を使ったスプライン補間

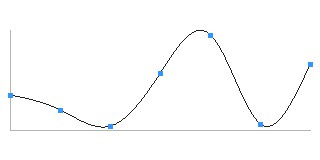
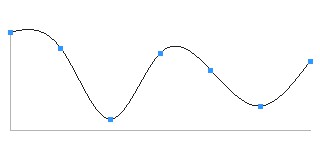
点と点を線で結んでグラフにする時、点同士の間を補完する必要があります。
単純に直線でつなぐだけの線形補間でもグラフにはできますが、全ての点を通る滑らかな曲線を描画するのであれば3次スプライン曲線を利用するのが一般的です。

spline2
spline1

<?php
$points = array();

$width  = 300;
$height = 100;

for($x=0; $x<=$width; $x+=50){
	$y = rand(0,100);
	$points[] = array($x, $y);
}
$spline = new CubicSpline($points);

$spline->draw($width, $height);

class CubicSpline
{
	private $xx = array();
	private $yy = array();
	private $q = array();
	private $r = array();
	private $s = array();
	private $n;
	private $points;
	
	
	function __construct($points){
		$this->points = $points;
		
		$this->n = $n = count($points) - 1;	// 区間の数
		$h = array();
		$b = array();
		
		// Step1
		for($i=0;$i < $n;$i++){
			$h[$i] = $points[$i + 1][0] - $points[$i][0];
		}
		
		for($i=1;$i < $n;$i++){
			$b[$i] = 2.0 * ($h[$i] + $h[$i - 1]);
			$d[$i] = 3.0 * (($points[$i + 1][1] - $points[$i][1])
				/ $h[$i] - ($points[$i][1] - $points[$i - 1][1]) / $h[$i - 1]);
		}
		
		// Step2
		$g[1] = $h[1] / $b[1];
		for($i=2;$i<$n - 1;$i++){
			$g[$i] = $h[$i] / ($b[$i] - $h[$i - 1] * $g[$i - 1]);
		}
		
		$u[1] = $d[1] / $b[1];
		
		for($i=2;$i<$n;$i++){
			$u[$i] = ($d[$i] - $h[$i - 1] * $u[$i - 1]) / ($b[$i] - $h[$i - 1] * $g[$i - 1]);
		}
		
		// Step3
		$this->r[0] = $this->r[$n] = 0.0;
		$this->r[$n - 1] = $u[$n - 1];
		for($i=$n - 2; $i >= 1; $i--){
			$this->r[$i] = $u[$i] - $g[$i] * $this->r[$i + 1];
		}
		
		//Step4
		for($i=0;$i<$n;$i++){
			$this->q[$i] = ($points[$i+1][1] - $points[$i][1]) / $h[$i] - $h[$i]
				* ($this->r[$i+1] + 2.0 * $this->r[$i]) / 3.0;
			$this->s[$i] = ($this->r[$i + 1] - $this->r[$i]) / (3.0 * $h[$i]);
		}
		
		return;
	}
	
	function value($x){
		$points = $this->points;
		$n = $this->n;
		$i = -1;
		
		// 区間の決定
		for($i1=1;$i1 < $n && $i < 0;$i1++){
			if($x < $points[$i1][0]){
				$i = $i1 - 1;
			}
		}
		if($i < 0){
			$i = $n - 1;
		}
		
		// 計算
		$x2 = $x - $points[$i][0];
		$y = $points[$i][1] + $x2
			* ($this->q[$i] + $x2 * ($this->r[$i] + $this->s[$i] * $x2));
		return $y;
	}
	
	public function draw($width, $height, $hMargin=10, $vMargin=30 ){
		$end = end($this->points);
		
		$image = imagecreatetruecolor($width + $hMargin * 2,
			$height + $vMargin * 2);
			
		$bg     = imagecolorallocate($image, 255, 255, 255);
		$axis   = imagecolorallocate($image, 180, 180,180);
		$color1 = imagecolorallocate($image, 30, 30, 30);
		$color2 = imagecolorallocate($image, 50, 150, 255);
		imagefill($image, 0, 0, $bg);

		imageline($image, $hMargin, $height + $vMargin,
			$hMargin + $width, $height + $vMargin, $axis);
		imageline($image, $hMargin, $vMargin,
			$hMargin, $height + $vMargin, $axis);
		
		$x1 = $y1 = $x2 = $y2 = 0;
		
		for($x=0;$x<$end[0];$x++){
			$x1 = $x2;
			$y1 = $y2;
		
			$x2 = $hMargin + $x;
			$y2 = ($height + $vMargin) - $this->value($x);
			if($x == 0) continue;
		   imageline($image, $x1, $y1, $x2, $y2, $color1);
		}
		
		foreach($this->points as $point){
			list($x, $y) = $point;
			$x = $hMargin + $x;
			$y = ($height + $vMargin) - $y;
			imagefilledrectangle($image, $x - 2, $y - 2,
				$x + 2, $y + 2, $color2);
		}
		
		header('Content-Type: image/jpeg');
		imagejpeg($image, null, 90);
		imagedestroy($image);
		 
		exit;
	}
}

サンプルではランダムに点をプロットしてそれらの点を通るスプライン曲線を描画しています。
クラスをインスタンス化する際に座標 array(x, y) を配列にしたものを渡し、draw() で画像として描画します。

このプログラムは下記参考 URL のソースコードを元に PHP で書きなおしたものです。

参考:
http://www.sist.ac.jp/~suganuma/cpp/2-bu/7-sho/7-sho.htm#e-7-42

[PHP]GDで折れ線グラフを描画する(改訂版)

前回作った棒グラフを拡張する形で折れ線グラフを作りました。

以前にも折れ線グラフを作ったことはあったのですが、その時は目盛や凡例の表示を省略した簡素なものだったので、改めて複数の線を重ねて表示できるように作り直しました。

line

<?php
mb_internal_encoding('utf-8');

$max	 = 100;	//上限
$step	 = 20;	//目盛の刻み

//値
$lines = array(
	array(
		'name'	 => 'line1',
		'values' => array(20, 50, 40, 80, 100, 90, 70),
		'color'	 => array(100, 180, 255)
	),
	array(
		'name'	 => 'line2',
		'values' => array(10, 30, 60, 70, 90, 90, 80),
		'color'	 => array(255, 150, 200)
	),
	array(
		'name'	 => 'line3',
		'values' => array(60, 70, 70, 50, 60, 40, 30),
		'color'	 => array(255, 255, 150)
	)
);
//ラベル
$labels = array('2000', '2001', '2002', '2003', '2004', '2005', '2006');
$label_rotate = false;

$title = 'Line Graph';
$show_legend = true;		//凡例の表示

$width	 = 320;
$height	 = 240;
$margin_top		 = 50;
$margin_right	 = 100;
$margin_bottom	 = 50;
$margin_left	 = 50;

//フォント
$font = 'migmix-1p-regular.ttf';
$font_size = 10;

$image = imagecreatetruecolor($width + $margin_left + $margin_right, $height + $margin_top + $margin_bottom);
imageantialias($image, true);

$org_x = $margin_left;
$org_y = $height + $margin_top;

//色
$bg_color   = imagecolorallocate($image, 10, 10, 10);		//背景
$text_color = imagecolorallocate($image, 255, 255, 255);	//テキスト
$grid_color = imagecolorallocate($image, 50, 50, 50);		//グリッド
$grid_spacing = $height / $max * $step;

imagefill($image, 0, 0, $bg_color);

for($i=0;$i<=floor($max / $step);$i++){
	if($i !== 0) imageline($image, $org_x, $org_y - $grid_spacing * $i, $org_x + $width, $org_y - $grid_spacing * $i, $grid_color);

	$text = $i * $step;
	$box = imagettfbbox($font_size, 0, $font, $text);
	$text_width = $box[2] - $box[6];
	$text_height = $box[3] - $box[7];
	
	$text_x = $org_x - $font_size;
	$text_y = $org_y - $grid_spacing * $i;
	imagettftext($image, $font_size, 0, (-1 * $text_width) + $text_x, ($text_height / 2) + $text_y, $text_color, $font, $text);
}

$count = count($lines[0]['values']);
$graph_spacing = floor( $width / $count);

$legend_x = $org_x + $width + 20;
$legend_y = $margin_top + 10;

//各グラフの描画
foreach($lines as $line){
	$values = $line['values'];
	$graph_color  = imagecolorallocate($image, $line['color'][0], $line['color'][1], $line['color'][2]);
	
	for($i=0;$i<$count;$i++){
		$graph_x = $org_x + $graph_spacing * $i + round($graph_spacing / 2);
		$graph_y = $org_y - $height * $values[$i] / $max;

		if(isset($prev)){
			imageline($image, $prev[0], $prev[1], $graph_x, $graph_y, $graph_color);
			imageline($image, $prev[0] + round($graph_spacing / 2), $org_y, $prev[0] + round($graph_spacing / 2), $org_y + 5, $text_color);
		} 
		imagefilledrectangle($image, $graph_x - 2, $graph_y - 2, $graph_x + 2, $graph_y + 2, $graph_color);
		

		$prev = array($graph_x,$graph_y);
	}
	
	//凡例の描画
	if($show_legend){
		$text = $line['name'];
		$box = imagettfbbox($font_size, 0, $font, $text);
		$text_width = $box[2] - $box[6];
		$text_height = $box[3] - $box[7];
		imagettftext($image, $font_size, 0, $legend_x, $legend_y, $graph_color, $font, '■ ' . $text);
		$legend_y = $legend_y + ($text_height * 2);
	}
	unset($prev);
}

for($i=0;$i<$count;$i++){
		$graph_x = $org_x + $graph_spacing * $i + round($graph_spacing / 2);
		
		$text = $labels[$i];
		$box = imagettfbbox($font_size, 0, $font, $text);
		$text_width = $box[2] - $box[6];
		$text_height = $box[3] - $box[7];
		
		if($label_rotate){
			$text_x = round($text_height / 2) + $graph_x;
			$text_y = $text_width + $org_y + $font_size;
			imagettftext($image, $font_size, 90, $text_x, $text_y, $text_color, $font, $text);
		} else {
			$text_x = round((-1 * $text_width / 2)) + $graph_x;
			$text_y = ($text_height / 2) + $org_y + $font_size * 2;
			imagettftext($image, $font_size, 0, $text_x, $text_y, $text_color, $font, $text);
		}
}

imageline($image, $org_x, $org_y, $org_x, $margin_top, $text_color);
imageline($image, $org_x, $org_y, $org_x + $width, $org_y, $text_color);

$box = imagettfbbox($font_size, 0, $font, $title);
$text_width	 = $box[2] - $box[6];
$text_height = $box[3] - $box[7];
$text_x = $org_x + $width / 2 - ($text_width / 2);
$text_y = $org_y - $height - $font_size * 2;
imagettftext($image, $font_size, 0, $text_x, $text_y, $text_color, $font, $title);

header('Content-type: image/png');
imagepng($image);

imagedestroy($image);

グラフは「名前」「値」「色」の要素を持つ多次元配列として指定します。
色は 0-255 の RGB 値をそれぞれ指定します。

凡例が不要な場合は $show_legend を false にします。
棒グラフ同様 X 軸の目盛は縦向きにできます。

今回もフォントには MigMix を使ったので同じディレクトリにアップロードして下さい。

MigMix フォント
http://mix-mplus-ipa.sourceforge.jp/

[PHP]GDを使った棒グラフの描画

前回作ったレーダーチャートにひき続いて今回は棒グラフを作ってみます。

配列で与えられた値とラベルをもとに棒グラフを描画します。

bar

<?php
$max	 = 100;	//上限
$step	 = 20;	//目盛の刻み

//値
$values = array(20, 50, 40, 80, 100, 90, 70);

//ラベル
$labels = array('Sun', 'Mon', 'Tue', 'Wed', 'Thu', 'Fri', 'Sat');
$label_rotate = false;

$title = "Bar Graph";

$width	 = 300;
$height	 = 200;
$bar_width = 20;
$margin_top		 = 50;
$margin_right	 = 30;
$margin_bottom	 = 50;
$margin_left	 = 50;

//フォント
$font = "migmix-1p-regular.ttf";
$font_size = 10;

$image = imagecreate($width + $margin_left + $margin_right, $height + $margin_top + $margin_bottom);

$org_x = $margin_left;
$org_y = $height + $margin_top;

//色
$bg_color   = imagecolorallocate($image, 10, 10, 10);		//背景
$line_color = imagecolorallocate($image, 255, 255, 255);	//線
$bar_color  = imagecolorallocate($image, 100, 180, 255);
$grid_color = imagecolorallocate($image, 50, 50, 50);		//
$font_color = imagecolorallocate($image, 255, 160, 200);
$grid_spacing = $height / $max * $step;

imagefill($image, 0, 0, $bg_color);

for($i=0;$i<=floor($max / $step);$i++){
	if($i !== 0) imageline($image, $org_x, $org_y - $grid_spacing * $i, $org_x + $width, $org_y - $grid_spacing * $i, $grid_color);

	$text = $i * $step;
	$box = imagettfbbox($font_size, 0, $font, $text);
	$text_width = $box[2] - $box[6];
	$text_height = $box[3] - $box[7];
	
	$text_x = $org_x - $font_size;
	$text_y = $org_y - $grid_spacing * $i;
	imagettftext($image, $font_size, 0, (-1 * $text_width) + $text_x, ($text_height / 2) + $text_y, $line_color, $font, $text);
}

$count = count($values);
$bar_spacing = floor( ($width - $bar_width) / $count);

for($i=0;$i<$count;$i++){
	$bar_x = $org_x + $bar_spacing * ($i + 1) - ($bar_spacing / 2);
	$bar_y = $org_y - $height * $values[$i] / $max;

	imagefilledrectangle($image, $bar_x, $org_y, $bar_x + $bar_width, $bar_y, $bar_color);

	$text = $labels[$i];
	$box = imagettfbbox($font_size, 0, $font, $text);
	$text_width = $box[2] - $box[6];
	$text_height = $box[3] - $box[7];
	
	if($label_rotate){
		$text_x = round(($text_height / 2) + ($bar_width / 2)) + $bar_x;
		$text_y = $text_width + $org_y + $font_size;
		imagettftext($image, $font_size, 90, $text_x, $text_y, $line_color, $font, $text);
	} else {
		$text_x = round((-1 * $text_width / 2) + ($bar_width / 2)) + $bar_x;
		$text_y = ($text_height / 2) + $org_y + $font_size * 2;
		imagettftext($image, $font_size, 0, $text_x, $text_y, $line_color, $font, $text);
	}
}

imageline($image, $org_x, $org_y, $org_x, $margin_top, $line_color);
imageline($image, $org_x, $org_y, $org_x + $width, $org_y, $line_color);

$box = imagettfbbox($font_size, 0, $font, $title);
$text_width	 = $box[2] - $box[6];
$text_height = $box[3] - $box[7];
$text_x = $org_x + $width / 2 - ($text_width / 2);
$text_y = $org_y - $height - $font_size * 2;
imagettftext($image, $font_size, 0, $text_x, $text_y, $line_color, $font, $title);

header("Content-type: image/png");
imagepng($image);

imagedestroy($image);

今回もフォントには MigMix を用いました。
同じディレクトリにアップロードして下さい。

MigMix フォント
http://mix-mplus-ipa.sourceforge.jp/

棒グラフの間隔が狭くてラベルを表示する場所が足りない場合は $label_rotate を true にすることで、文字を縦にすることができるようにしました。
グラフ領域の上下左右の余白は margin として設定できます。ラベルや目盛を表示できるように余白を確保して下さい。