[PHP]GDで図形を描画する際のジャギーを軽減する(アンチエイリアス)

通常 GD を用いて円や直線を描画した場合、全くアンチエイリアス処理がなされないため、縁がギザギザしているように見えてしまいます。(ジャギー)

1

精度の高い軽量なアンチエイリアス処理(ジャギーを軽減する処理)を求めるなら何らかのアルゴリズムを使った計算を行うべきですが、今回は単純に、あらかじめ大きな画像として描画しておいて、それを表示サイズまで縮小する方法でジャギーを軽減してみます。

2
2倍

3
3倍

二倍サイズで描画したものを表示サイズに縮小するだけでかなりジャギーは目立たなくなります。
三倍ならほとんど気になりません。

GD のリサイズではピクセルの補間が行われるため拡大・縮小時には滑らかに処理されます。
今回の方法はその性質を利用したものです。

本来 GD には imageantialias() という専用の関数があるのですが、環境や対象によっては機能しないことが多いので、現時点ではこの手法も役に立つと思います。

・検証用サンプル

<?php
$canvas_size = 120;
$circle_size = 100;
$scale = 3;

$image	 = imagecreatetruecolor($canvas_size, $canvas_size);
$circle	 = imagecreatetruecolor($canvas_size * $scale, $canvas_size * $scale);

$color = imagecolorallocate( $circle, 255, 255, 255 );
imagefilledellipse($circle, $canvas_size * $scale / 2, $canvas_size * $scale / 2, $circle_size * $scale, $circle_size * $scale, $color);
imagecopyresampled($image, $circle, 0, 0, 0, 0, $canvas_size, $canvas_size, $canvas_size * $scale, $canvas_size * $scale);

header("Content-type: image/png");
imagepng($image);

imagedestroy($image);
imagedestroy($circle);

[PHP]GDで折れ線グラフを描画する(改訂版)

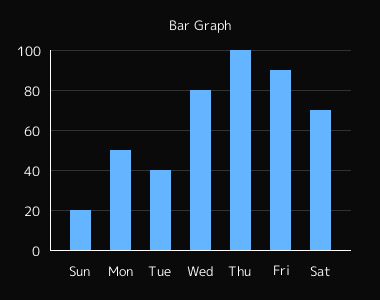
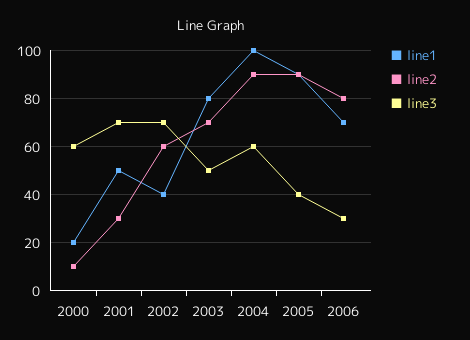
前回作った棒グラフを拡張する形で折れ線グラフを作りました。

以前にも折れ線グラフを作ったことはあったのですが、その時は目盛や凡例の表示を省略した簡素なものだったので、改めて複数の線を重ねて表示できるように作り直しました。

line

<?php
mb_internal_encoding('utf-8');

$max	 = 100;	//上限
$step	 = 20;	//目盛の刻み

//値
$lines = array(
	array(
		'name'	 => 'line1',
		'values' => array(20, 50, 40, 80, 100, 90, 70),
		'color'	 => array(100, 180, 255)
	),
	array(
		'name'	 => 'line2',
		'values' => array(10, 30, 60, 70, 90, 90, 80),
		'color'	 => array(255, 150, 200)
	),
	array(
		'name'	 => 'line3',
		'values' => array(60, 70, 70, 50, 60, 40, 30),
		'color'	 => array(255, 255, 150)
	)
);
//ラベル
$labels = array('2000', '2001', '2002', '2003', '2004', '2005', '2006');
$label_rotate = false;

$title = 'Line Graph';
$show_legend = true;		//凡例の表示

$width	 = 320;
$height	 = 240;
$margin_top		 = 50;
$margin_right	 = 100;
$margin_bottom	 = 50;
$margin_left	 = 50;

//フォント
$font = 'migmix-1p-regular.ttf';
$font_size = 10;

$image = imagecreatetruecolor($width + $margin_left + $margin_right, $height + $margin_top + $margin_bottom);
imageantialias($image, true);

$org_x = $margin_left;
$org_y = $height + $margin_top;

//色
$bg_color   = imagecolorallocate($image, 10, 10, 10);		//背景
$text_color = imagecolorallocate($image, 255, 255, 255);	//テキスト
$grid_color = imagecolorallocate($image, 50, 50, 50);		//グリッド
$grid_spacing = $height / $max * $step;

imagefill($image, 0, 0, $bg_color);

for($i=0;$i<=floor($max / $step);$i++){
	if($i !== 0) imageline($image, $org_x, $org_y - $grid_spacing * $i, $org_x + $width, $org_y - $grid_spacing * $i, $grid_color);

	$text = $i * $step;
	$box = imagettfbbox($font_size, 0, $font, $text);
	$text_width = $box[2] - $box[6];
	$text_height = $box[3] - $box[7];
	
	$text_x = $org_x - $font_size;
	$text_y = $org_y - $grid_spacing * $i;
	imagettftext($image, $font_size, 0, (-1 * $text_width) + $text_x, ($text_height / 2) + $text_y, $text_color, $font, $text);
}

$count = count($lines[0]['values']);
$graph_spacing = floor( $width / $count);

$legend_x = $org_x + $width + 20;
$legend_y = $margin_top + 10;

//各グラフの描画
foreach($lines as $line){
	$values = $line['values'];
	$graph_color  = imagecolorallocate($image, $line['color'][0], $line['color'][1], $line['color'][2]);
	
	for($i=0;$i<$count;$i++){
		$graph_x = $org_x + $graph_spacing * $i + round($graph_spacing / 2);
		$graph_y = $org_y - $height * $values[$i] / $max;

		if(isset($prev)){
			imageline($image, $prev[0], $prev[1], $graph_x, $graph_y, $graph_color);
			imageline($image, $prev[0] + round($graph_spacing / 2), $org_y, $prev[0] + round($graph_spacing / 2), $org_y + 5, $text_color);
		} 
		imagefilledrectangle($image, $graph_x - 2, $graph_y - 2, $graph_x + 2, $graph_y + 2, $graph_color);
		

		$prev = array($graph_x,$graph_y);
	}
	
	//凡例の描画
	if($show_legend){
		$text = $line['name'];
		$box = imagettfbbox($font_size, 0, $font, $text);
		$text_width = $box[2] - $box[6];
		$text_height = $box[3] - $box[7];
		imagettftext($image, $font_size, 0, $legend_x, $legend_y, $graph_color, $font, '■ ' . $text);
		$legend_y = $legend_y + ($text_height * 2);
	}
	unset($prev);
}

for($i=0;$i<$count;$i++){
		$graph_x = $org_x + $graph_spacing * $i + round($graph_spacing / 2);
		
		$text = $labels[$i];
		$box = imagettfbbox($font_size, 0, $font, $text);
		$text_width = $box[2] - $box[6];
		$text_height = $box[3] - $box[7];
		
		if($label_rotate){
			$text_x = round($text_height / 2) + $graph_x;
			$text_y = $text_width + $org_y + $font_size;
			imagettftext($image, $font_size, 90, $text_x, $text_y, $text_color, $font, $text);
		} else {
			$text_x = round((-1 * $text_width / 2)) + $graph_x;
			$text_y = ($text_height / 2) + $org_y + $font_size * 2;
			imagettftext($image, $font_size, 0, $text_x, $text_y, $text_color, $font, $text);
		}
}

imageline($image, $org_x, $org_y, $org_x, $margin_top, $text_color);
imageline($image, $org_x, $org_y, $org_x + $width, $org_y, $text_color);

$box = imagettfbbox($font_size, 0, $font, $title);
$text_width	 = $box[2] - $box[6];
$text_height = $box[3] - $box[7];
$text_x = $org_x + $width / 2 - ($text_width / 2);
$text_y = $org_y - $height - $font_size * 2;
imagettftext($image, $font_size, 0, $text_x, $text_y, $text_color, $font, $title);

header('Content-type: image/png');
imagepng($image);

imagedestroy($image);

グラフは「名前」「値」「色」の要素を持つ多次元配列として指定します。
色は 0-255 の RGB 値をそれぞれ指定します。

凡例が不要な場合は $show_legend を false にします。
棒グラフ同様 X 軸の目盛は縦向きにできます。

今回もフォントには MigMix を使ったので同じディレクトリにアップロードして下さい。

MigMix フォント
http://mix-mplus-ipa.sourceforge.jp/

[PHP]GDを使った棒グラフの描画

前回作ったレーダーチャートにひき続いて今回は棒グラフを作ってみます。

配列で与えられた値とラベルをもとに棒グラフを描画します。

bar

<?php
$max	 = 100;	//上限
$step	 = 20;	//目盛の刻み

//値
$values = array(20, 50, 40, 80, 100, 90, 70);

//ラベル
$labels = array('Sun', 'Mon', 'Tue', 'Wed', 'Thu', 'Fri', 'Sat');
$label_rotate = false;

$title = "Bar Graph";

$width	 = 300;
$height	 = 200;
$bar_width = 20;
$margin_top		 = 50;
$margin_right	 = 30;
$margin_bottom	 = 50;
$margin_left	 = 50;

//フォント
$font = "migmix-1p-regular.ttf";
$font_size = 10;

$image = imagecreate($width + $margin_left + $margin_right, $height + $margin_top + $margin_bottom);

$org_x = $margin_left;
$org_y = $height + $margin_top;

//色
$bg_color   = imagecolorallocate($image, 10, 10, 10);		//背景
$line_color = imagecolorallocate($image, 255, 255, 255);	//線
$bar_color  = imagecolorallocate($image, 100, 180, 255);
$grid_color = imagecolorallocate($image, 50, 50, 50);		//
$font_color = imagecolorallocate($image, 255, 160, 200);
$grid_spacing = $height / $max * $step;

imagefill($image, 0, 0, $bg_color);

for($i=0;$i<=floor($max / $step);$i++){
	if($i !== 0) imageline($image, $org_x, $org_y - $grid_spacing * $i, $org_x + $width, $org_y - $grid_spacing * $i, $grid_color);

	$text = $i * $step;
	$box = imagettfbbox($font_size, 0, $font, $text);
	$text_width = $box[2] - $box[6];
	$text_height = $box[3] - $box[7];
	
	$text_x = $org_x - $font_size;
	$text_y = $org_y - $grid_spacing * $i;
	imagettftext($image, $font_size, 0, (-1 * $text_width) + $text_x, ($text_height / 2) + $text_y, $line_color, $font, $text);
}

$count = count($values);
$bar_spacing = floor( ($width - $bar_width) / $count);

for($i=0;$i<$count;$i++){
	$bar_x = $org_x + $bar_spacing * ($i + 1) - ($bar_spacing / 2);
	$bar_y = $org_y - $height * $values[$i] / $max;

	imagefilledrectangle($image, $bar_x, $org_y, $bar_x + $bar_width, $bar_y, $bar_color);

	$text = $labels[$i];
	$box = imagettfbbox($font_size, 0, $font, $text);
	$text_width = $box[2] - $box[6];
	$text_height = $box[3] - $box[7];
	
	if($label_rotate){
		$text_x = round(($text_height / 2) + ($bar_width / 2)) + $bar_x;
		$text_y = $text_width + $org_y + $font_size;
		imagettftext($image, $font_size, 90, $text_x, $text_y, $line_color, $font, $text);
	} else {
		$text_x = round((-1 * $text_width / 2) + ($bar_width / 2)) + $bar_x;
		$text_y = ($text_height / 2) + $org_y + $font_size * 2;
		imagettftext($image, $font_size, 0, $text_x, $text_y, $line_color, $font, $text);
	}
}

imageline($image, $org_x, $org_y, $org_x, $margin_top, $line_color);
imageline($image, $org_x, $org_y, $org_x + $width, $org_y, $line_color);

$box = imagettfbbox($font_size, 0, $font, $title);
$text_width	 = $box[2] - $box[6];
$text_height = $box[3] - $box[7];
$text_x = $org_x + $width / 2 - ($text_width / 2);
$text_y = $org_y - $height - $font_size * 2;
imagettftext($image, $font_size, 0, $text_x, $text_y, $line_color, $font, $title);

header("Content-type: image/png");
imagepng($image);

imagedestroy($image);

今回もフォントには MigMix を用いました。
同じディレクトリにアップロードして下さい。

MigMix フォント
http://mix-mplus-ipa.sourceforge.jp/

棒グラフの間隔が狭くてラベルを表示する場所が足りない場合は $label_rotate を true にすることで、文字を縦にすることができるようにしました。
グラフ領域の上下左右の余白は margin として設定できます。ラベルや目盛を表示できるように余白を確保して下さい。