以前の記事で座標の回転を行う関数を作ったので、
それを利用する形で本格的なレーダーチャートを作ります。
<?php
//値
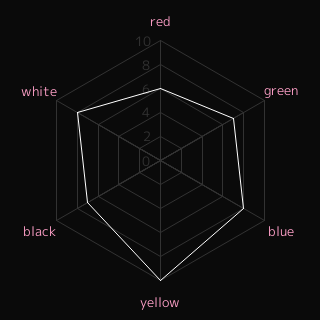
$values = array(6,7,8,10,7,8);
//ラベル
$labels = array("red", "green", "blue", "yellow", "black", "white");
$max = 10; //上限
$step = 2; //目盛の間隔
$margin = 80; //グラフの余白
$text_margin = 20; //ラベルの余白
$size = 240; //サイズ(正方形)
//フォント
$font = "migmix-1p-regular.ttf";
$font_size = 10;
//画像
$image = imagecreatetruecolor( $size + $margin , $size + $margin);
imageantialias($image, true);
//色
$bg = imagecolorallocate($image, 10, 10, 10); // 背景
$line = imagecolorallocate($image, 255, 255, 255); // チャートの線
$grid = imagecolorallocate($image, 50, 50, 50); // グリッドの色
$font_color = imagecolorallocate($image, 255, 160, 200);
$center_x = round(($size + $margin) / 2);
$center_y = round(($size + $margin) / 2);
$count = count($values);
$div = round(360 / $count);
$length = round($size / 2);
// 背景の描画
imagefill($image, 0, 0, $bg);
for($i = 1;$i<=$max;$i++){
if($i%$step != 0) continue;
$points = array();
for($j=0;$j<$count;$j++){
list($x, $y) = point_rotate($length * ($i / $max), $div * $j - 90);
$point = array($x + $center_x, $y + $center_y);
imageline($image, $center_x, $center_y, $point[0], $point[1], $grid);
$points = array_merge($points, $point);
}
imagepolygon($image, $points, $count, $grid);
}
// 文字の描画
for($i = 0;$i<$count;$i++){
$box = imagettfbbox($font_size, 0, $font, $labels[$i]);
$text_width = $box[2] - $box[6];
$text_height = $box[3] - $box[7];
list($x, $y) = point_rotate($length + $text_margin, $div * $i - 90);
$text_x = (-1 * $text_width / 2) + $center_x + $x;
$text_y = ($text_height / 2) + $center_y + $y;
imagettftext($image, $font_size, 0, $text_x, $text_y, $font_color, $font, $labels[$i]);
}
for($i=0;$i<=$max;$i=$i+$step){
$box = imagettfbbox($font_size, 0, $font, $i);
$text_width = $box[2] - $box[6];
$text_height = $box[3] - $box[7];
$text_x = (-1 * $text_width) + $center_x - $font_size;
$text_y = ($text_height / 2) + $center_y - ($length * ($i / $max));
imagettftext($image, $font_size, 0, $text_x, $text_y, $grid, $font, $i);
}
// グラフの描画
$points = array();
for($i=0;$i<$count;$i++){
$value = $length * $values[$i] / $max;
list($x, $y) = point_rotate($value, $div * $i - 90);
$point = array($x + $center_x, $y + $center_y);
$points = array_merge($points, $point);
}
imagepolygon($image, $points, $count, $line);
// 画像の出力
header('Content-type: image/png');
imagepng($image);
imagedestroy($image);
function point_rotate($length, $angle){
$angle = deg2rad($angle);
$x = round($length * cos($angle));
$y = round($length * sin($angle));
return array($x, $y);
}
?>
このプログラムを利用するには同じフォルダにフォントファイルをアップロードしておく必要があります。
今回はフリーフォント MigMix を利用しました。
MigMix フォント
http://mix-mplus-ipa.sourceforge.jp/
このプログラムでは項目数に応じた多角形のレーダーチャートを生成できます。
頂点には項目名が表示され、垂直の軸にはメモリが表示されます。
目盛の間隔(step)を調整することで、10 ごとに目盛線を入れる等の設定ができます。
項目名が長くなる場合はテキストの余白($text_margin)を大きめにとって下さい。
Similar Posts:
- [PHP]GDを使った棒グラフの描画
- [PHP]GDで折れ線グラフを描画する(改訂版)
- [PHP]中心から角度を指定して線を引く(座標の回転)
- [PHP]3次スプライン曲線を使ったスプライン補間
- [HTML5+JS+Canvas, PHP]アナログ時計の作り方
- [PHP]複数の画像をランダムに敷き詰めて一枚の画像に合成
- [PHP]回転軸を指定して座標を回転させる
- [PHP]GDでアンチエイリアスのかかった綺麗な楕円を描く
