点と点を線で結んでグラフにする時、点同士の間を補完する必要があります。
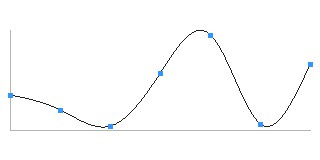
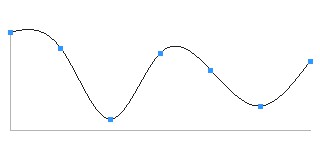
単純に直線でつなぐだけの線形補間でもグラフにはできますが、全ての点を通る滑らかな曲線を描画するのであれば3次スプライン曲線を利用するのが一般的です。
<?php
$points = array();

$width  = 300;
$height = 100;

for($x=0; $x<=$width; $x+=50){
	$y = rand(0,100);
	$points[] = array($x, $y);
}
$spline = new CubicSpline($points);

$spline->draw($width, $height);

class CubicSpline
{
	private $xx = array();
	private $yy = array();
	private $q = array();
	private $r = array();
	private $s = array();
	private $n;
	private $points;


	function __construct($points){
		$this->points = $points;

		$this->n = $n = count($points) - 1;	// 区間の数
		$h = array();
		$b = array();

		// Step1
		for($i=0;$i < $n;$i++){
			$h[$i] = $points[$i + 1][0] - $points[$i][0];
		}

		for($i=1;$i < $n;$i++){
			$b[$i] = 2.0 * ($h[$i] + $h[$i - 1]);
			$d[$i] = 3.0 * (($points[$i + 1][1] - $points[$i][1])
				/ $h[$i] - ($points[$i][1] - $points[$i - 1][1]) / $h[$i - 1]);
		}

		// Step2
		$g[1] = $h[1] / $b[1];
		for($i=2;$i<$n - 1;$i++){
			$g[$i] = $h[$i] / ($b[$i] - $h[$i - 1] * $g[$i - 1]);
		}

		$u[1] = $d[1] / $b[1];

		for($i=2;$i<$n;$i++){
			$u[$i] = ($d[$i] - $h[$i - 1] * $u[$i - 1]) / ($b[$i] - $h[$i - 1] * $g[$i - 1]);
		}

		// Step3
		$this->r[0] = $this->r[$n] = 0.0;
		$this->r[$n - 1] = $u[$n - 1];
		for($i=$n - 2; $i >= 1; $i--){
			$this->r[$i] = $u[$i] - $g[$i] * $this->r[$i + 1];
		}

		//Step4
		for($i=0;$i<$n;$i++){
			$this->q[$i] = ($points[$i+1][1] - $points[$i][1]) / $h[$i] - $h[$i]
				* ($this->r[$i+1] + 2.0 * $this->r[$i]) / 3.0;
			$this->s[$i] = ($this->r[$i + 1] - $this->r[$i]) / (3.0 * $h[$i]);
		}

		return;
	}

	function value($x){
		$points = $this->points;
		$n = $this->n;
		$i = -1;

		// 区間の決定
		for($i1=1;$i1 < $n && $i < 0;$i1++){
			if($x < $points[$i1][0]){
				$i = $i1 - 1;
			}
		}
		if($i < 0){
			$i = $n - 1;
		}

		// 計算
		$x2 = $x - $points[$i][0];
		$y = $points[$i][1] + $x2
			* ($this->q[$i] + $x2 * ($this->r[$i] + $this->s[$i] * $x2));
		return $y;
	}

	public function draw($width, $height, $hMargin=10, $vMargin=30 ){
		$end = end($this->points);

		$image = imagecreatetruecolor($width + $hMargin * 2,
			$height + $vMargin * 2);

		$bg     = imagecolorallocate($image, 255, 255, 255);
		$axis   = imagecolorallocate($image, 180, 180,180);
		$color1 = imagecolorallocate($image, 30, 30, 30);
		$color2 = imagecolorallocate($image, 50, 150, 255);
		imagefill($image, 0, 0, $bg);

		imageline($image, $hMargin, $height + $vMargin,
			$hMargin + $width, $height + $vMargin, $axis);
		imageline($image, $hMargin, $vMargin,
			$hMargin, $height + $vMargin, $axis);

		$x1 = $y1 = $x2 = $y2 = 0;

		for($x=0;$x<$end[0];$x++){
			$x1 = $x2;
			$y1 = $y2;

			$x2 = $hMargin + $x;
			$y2 = ($height + $vMargin) - $this->value($x);
			if($x == 0) continue;
		   imageline($image, $x1, $y1, $x2, $y2, $color1);
		}

		foreach($this->points as $point){
			list($x, $y) = $point;
			$x = $hMargin + $x;
			$y = ($height + $vMargin) - $y;
			imagefilledrectangle($image, $x - 2, $y - 2,
				$x + 2, $y + 2, $color2);
		}

		header('Content-Type: image/jpeg');
		imagejpeg($image, null, 90);
		imagedestroy($image);

		exit;
	}
}
サンプルではランダムに点をプロットしてそれらの点を通るスプライン曲線を描画しています。
クラスをインスタンス化する際に座標 array(x, y) を配列にしたものを渡し、draw() で画像として描画します。
このプログラムは下記参考 URL のソースコードを元に PHP で書きなおしたものです。
参考:
http://www.sist.ac.jp/~suganuma/cpp/2-bu/7-sho/7-sho.htm#e-7-42
Similar Posts:
- [PHP]レーダーチャート(クモの巣グラフ)をGDで描画する
- [PHP]GDを使った棒グラフの描画
- [PHP]GDで折れ線グラフを描画する(改訂版)
- [PHP]中心から角度を指定して線を引く(座標の回転)
- [PHP]GDでアンチエイリアスのかかった綺麗な楕円を描く
- [PHP]複数の画像をランダムに敷き詰めて一枚の画像に合成
- [PHP]円グラフを表示する(GD)
- [HTML5+JS+Canvas, PHP]アナログ時計の作り方
