[PHP]3次スプライン曲線を使ったスプライン補間

点と点を線で結んでグラフにする時、点同士の間を補完する必要があります。
単純に直線でつなぐだけの線形補間でもグラフにはできますが、全ての点を通る滑らかな曲線を描画するのであれば3次スプライン曲線を利用するのが一般的です。
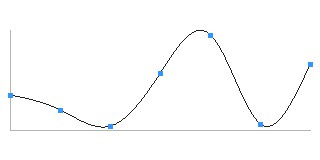
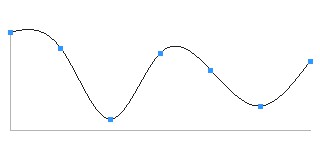
spline2
spline1

1
2
3
4
5
6
7
8
9
10
11
12
13
14
15
16
17
18
19
20
21
22
23
24
25
26
27
28
29
30
31
32
33
34
35
36
37
38
39
40
41
42
43
44
45
46
47
48
49
50
51
52
53
54
55
56
57
58
59
60
61
62
63
64
65
66
67
68
69
70
71
72
73
74
75
76
77
78
79
80
81
82
83
84
85
86
87
88
89
90
91
92
93
94
95
96
97
98
99
100
101
102
103
104
105
106
107
108
109
110
111
112
113
114
115
116
117
118
119
120
121
122
123
124
125
126
127
128
129
130
131
132
133
134
135
136
137
138
<?php
$points = array();
 
$width  = 300;
$height = 100;
 
for($x=0; $x<=$width; $x+=50){
    $y = rand(0,100);
    $points[] = array($x, $y);
}
$spline = new CubicSpline($points);
 
$spline->draw($width, $height);
 
class CubicSpline
{
    private $xx = array();
    private $yy = array();
    private $q = array();
    private $r = array();
    private $s = array();
    private $n;
    private $points;
     
     
    function __construct($points){
        $this->points = $points;
         
        $this->n = $n = count($points) - 1;  // 区間の数
        $h = array();
        $b = array();
         
        // Step1
        for($i=0;$i < $n;$i++){
            $h[$i] = $points[$i + 1][0] - $points[$i][0];
        }
         
        for($i=1;$i < $n;$i++){
            $b[$i] = 2.0 * ($h[$i] + $h[$i - 1]);
            $d[$i] = 3.0 * (($points[$i + 1][1] - $points[$i][1])
                / $h[$i] - ($points[$i][1] - $points[$i - 1][1]) / $h[$i - 1]);
        }
         
        // Step2
        $g[1] = $h[1] / $b[1];
        for($i=2;$i<$n - 1;$i++){
            $g[$i] = $h[$i] / ($b[$i] - $h[$i - 1] * $g[$i - 1]);
        }
         
        $u[1] = $d[1] / $b[1];
         
        for($i=2;$i<$n;$i++){
            $u[$i] = ($d[$i] - $h[$i - 1] * $u[$i - 1]) / ($b[$i] - $h[$i - 1] * $g[$i - 1]);
        }
         
        // Step3
        $this->r[0] = $this->r[$n] = 0.0;
        $this->r[$n - 1] = $u[$n - 1];
        for($i=$n - 2; $i >= 1; $i--){
            $this->r[$i] = $u[$i] - $g[$i] * $this->r[$i + 1];
        }
         
        //Step4
        for($i=0;$i<$n;$i++){
            $this->q[$i] = ($points[$i+1][1] - $points[$i][1]) / $h[$i] - $h[$i]
                * ($this->r[$i+1] + 2.0 * $this->r[$i]) / 3.0;
            $this->s[$i] = ($this->r[$i + 1] - $this->r[$i]) / (3.0 * $h[$i]);
        }
         
        return;
    }
     
    function value($x){
        $points = $this->points;
        $n = $this->n;
        $i = -1;
         
        // 区間の決定
        for($i1=1;$i1 < $n && $i < 0;$i1++){
            if($x < $points[$i1][0]){
                $i = $i1 - 1;
            }
        }
        if($i < 0){
            $i = $n - 1;
        }
         
        // 計算
        $x2 = $x - $points[$i][0];
        $y = $points[$i][1] + $x2
            * ($this->q[$i] + $x2 * ($this->r[$i] + $this->s[$i] * $x2));
        return $y;
    }
     
    public function draw($width, $height, $hMargin=10, $vMargin=30 ){
        $end = end($this->points);
         
        $image = imagecreatetruecolor($width + $hMargin * 2,
            $height + $vMargin * 2);
             
        $bg     = imagecolorallocate($image, 255, 255, 255);
        $axis   = imagecolorallocate($image, 180, 180,180);
        $color1 = imagecolorallocate($image, 30, 30, 30);
        $color2 = imagecolorallocate($image, 50, 150, 255);
        imagefill($image, 0, 0, $bg);
 
        imageline($image, $hMargin, $height + $vMargin,
            $hMargin + $width, $height + $vMargin, $axis);
        imageline($image, $hMargin, $vMargin,
            $hMargin, $height + $vMargin, $axis);
         
        $x1 = $y1 = $x2 = $y2 = 0;
         
        for($x=0;$x<$end[0];$x++){
            $x1 = $x2;
            $y1 = $y2;
         
            $x2 = $hMargin + $x;
            $y2 = ($height + $vMargin) - $this->value($x);
            if($x == 0) continue;
           imageline($image, $x1, $y1, $x2, $y2, $color1);
        }
         
        foreach($this->points as $point){
            list($x, $y) = $point;
            $x = $hMargin + $x;
            $y = ($height + $vMargin) - $y;
            imagefilledrectangle($image, $x - 2, $y - 2,
                $x + 2, $y + 2, $color2);
        }
         
        header('Content-Type: image/jpeg');
        imagejpeg($image, null, 90);
        imagedestroy($image);
          
        exit;
    }
}

サンプルではランダムに点をプロットしてそれらの点を通るスプライン曲線を描画しています。
クラスをインスタンス化する際に座標 array(x, y) を配列にしたものを渡し、draw() で画像として描画します。

このプログラムは下記参考 URL のソースコードを元に PHP で書きなおしたものです。

参考:
http://www.sist.ac.jp/~suganuma/cpp/2-bu/7-sho/7-sho.htm#e-7-42

[PHP]GDで折れ線グラフを描画する(改訂版)

前回作った棒グラフを拡張する形で折れ線グラフを作りました。

以前にも折れ線グラフを作ったことはあったのですが、その時は目盛や凡例の表示を省略した簡素なものだったので、改めて複数の線を重ねて表示できるように作り直しました。

line

1
2
3
4
5
6
7
8
9
10
11
12
13
14
15
16
17
18
19
20
21
22
23
24
25
26
27
28
29
30
31
32
33
34
35
36
37
38
39
40
41
42
43
44
45
46
47
48
49
50
51
52
53
54
55
56
57
58
59
60
61
62
63
64
65
66
67
68
69
70
71
72
73
74
75
76
77
78
79
80
81
82
83
84
85
86
87
88
89
90
91
92
93
94
95
96
97
98
99
100
101
102
103
104
105
106
107
108
109
110
111
112
113
114
115
116
117
118
119
120
121
122
123
124
125
126
127
128
129
130
131
132
133
134
135
136
137
138
139
<?php
mb_internal_encoding('utf-8');
 
$max     = 100; //上限
$step    = 20;  //目盛の刻み
 
//値
$lines = array(
    array(
        'name'   => 'line1',
        'values' => array(20, 50, 40, 80, 100, 90, 70),
        'color'  => array(100, 180, 255)
    ),
    array(
        'name'   => 'line2',
        'values' => array(10, 30, 60, 70, 90, 90, 80),
        'color'  => array(255, 150, 200)
    ),
    array(
        'name'   => 'line3',
        'values' => array(60, 70, 70, 50, 60, 40, 30),
        'color'  => array(255, 255, 150)
    )
);
//ラベル
$labels = array('2000', '2001', '2002', '2003', '2004', '2005', '2006');
$label_rotate = false;
 
$title = 'Line Graph';
$show_legend = true;        //凡例の表示
 
$width   = 320;
$height  = 240;
$margin_top      = 50;
$margin_right    = 100;
$margin_bottom   = 50;
$margin_left     = 50;
 
//フォント
$font = 'migmix-1p-regular.ttf';
$font_size = 10;
 
$image = imagecreatetruecolor($width + $margin_left + $margin_right, $height + $margin_top + $margin_bottom);
imageantialias($image, true);
 
$org_x = $margin_left;
$org_y = $height + $margin_top;
 
//色
$bg_color   = imagecolorallocate($image, 10, 10, 10);       //背景
$text_color = imagecolorallocate($image, 255, 255, 255);    //テキスト
$grid_color = imagecolorallocate($image, 50, 50, 50);       //グリッド
$grid_spacing = $height / $max * $step;
 
imagefill($image, 0, 0, $bg_color);
 
for($i=0;$i<=floor($max / $step);$i++){
    if($i !== 0) imageline($image, $org_x, $org_y - $grid_spacing * $i, $org_x + $width, $org_y - $grid_spacing * $i, $grid_color);
 
    $text = $i * $step;
    $box = imagettfbbox($font_size, 0, $font, $text);
    $text_width = $box[2] - $box[6];
    $text_height = $box[3] - $box[7];
     
    $text_x = $org_x - $font_size;
    $text_y = $org_y - $grid_spacing * $i;
    imagettftext($image, $font_size, 0, (-1 * $text_width) + $text_x, ($text_height / 2) + $text_y, $text_color, $font, $text);
}
 
$count = count($lines[0]['values']);
$graph_spacing = floor( $width / $count);
 
$legend_x = $org_x + $width + 20;
$legend_y = $margin_top + 10;
 
//各グラフの描画
foreach($lines as $line){
    $values = $line['values'];
    $graph_color  = imagecolorallocate($image, $line['color'][0], $line['color'][1], $line['color'][2]);
     
    for($i=0;$i<$count;$i++){
        $graph_x = $org_x + $graph_spacing * $i + round($graph_spacing / 2);
        $graph_y = $org_y - $height * $values[$i] / $max;
 
        if(isset($prev)){
            imageline($image, $prev[0], $prev[1], $graph_x, $graph_y, $graph_color);
            imageline($image, $prev[0] + round($graph_spacing / 2), $org_y, $prev[0] + round($graph_spacing / 2), $org_y + 5, $text_color);
        }
        imagefilledrectangle($image, $graph_x - 2, $graph_y - 2, $graph_x + 2, $graph_y + 2, $graph_color);
         
 
        $prev = array($graph_x,$graph_y);
    }
     
    //凡例の描画
    if($show_legend){
        $text = $line['name'];
        $box = imagettfbbox($font_size, 0, $font, $text);
        $text_width = $box[2] - $box[6];
        $text_height = $box[3] - $box[7];
        imagettftext($image, $font_size, 0, $legend_x, $legend_y, $graph_color, $font, '■ ' . $text);
        $legend_y = $legend_y + ($text_height * 2);
    }
    unset($prev);
}
 
for($i=0;$i<$count;$i++){
        $graph_x = $org_x + $graph_spacing * $i + round($graph_spacing / 2);
         
        $text = $labels[$i];
        $box = imagettfbbox($font_size, 0, $font, $text);
        $text_width = $box[2] - $box[6];
        $text_height = $box[3] - $box[7];
         
        if($label_rotate){
            $text_x = round($text_height / 2) + $graph_x;
            $text_y = $text_width + $org_y + $font_size;
            imagettftext($image, $font_size, 90, $text_x, $text_y, $text_color, $font, $text);
        } else {
            $text_x = round((-1 * $text_width / 2)) + $graph_x;
            $text_y = ($text_height / 2) + $org_y + $font_size * 2;
            imagettftext($image, $font_size, 0, $text_x, $text_y, $text_color, $font, $text);
        }
}
 
imageline($image, $org_x, $org_y, $org_x, $margin_top, $text_color);
imageline($image, $org_x, $org_y, $org_x + $width, $org_y, $text_color);
 
$box = imagettfbbox($font_size, 0, $font, $title);
$text_width  = $box[2] - $box[6];
$text_height = $box[3] - $box[7];
$text_x = $org_x + $width / 2 - ($text_width / 2);
$text_y = $org_y - $height - $font_size * 2;
imagettftext($image, $font_size, 0, $text_x, $text_y, $text_color, $font, $title);
 
header('Content-type: image/png');
imagepng($image);
 
imagedestroy($image);

グラフは「名前」「値」「色」の要素を持つ多次元配列として指定します。
色は 0-255 の RGB 値をそれぞれ指定します。

凡例が不要な場合は $show_legend を false にします。
棒グラフ同様 X 軸の目盛は縦向きにできます。

今回もフォントには MigMix を使ったので同じディレクトリにアップロードして下さい。

MigMix フォント
http://mix-mplus-ipa.sourceforge.jp/

[PHP]GDを使った棒グラフの描画

前回作ったレーダーチャートにひき続いて今回は棒グラフを作ってみます。

配列で与えられた値とラベルをもとに棒グラフを描画します。

bar

1
2
3
4
5
6
7
8
9
10
11
12
13
14
15
16
17
18
19
20
21
22
23
24
25
26
27
28
29
30
31
32
33
34
35
36
37
38
39
40
41
42
43
44
45
46
47
48
49
50
51
52
53
54
55
56
57
58
59
60
61
62
63
64
65
66
67
68
69
70
71
72
73
74
75
76
77
78
79
80
81
82
83
84
85
86
87
88
89
90
91
92
<?php
$max     = 100; //上限
$step    = 20;  //目盛の刻み
 
//値
$values = array(20, 50, 40, 80, 100, 90, 70);
 
//ラベル
$labels = array('Sun', 'Mon', 'Tue', 'Wed', 'Thu', 'Fri', 'Sat');
$label_rotate = false;
 
$title = "Bar Graph";
 
$width   = 300;
$height  = 200;
$bar_width = 20;
$margin_top      = 50;
$margin_right    = 30;
$margin_bottom   = 50;
$margin_left     = 50;
 
//フォント
$font = "migmix-1p-regular.ttf";
$font_size = 10;
 
$image = imagecreate($width + $margin_left + $margin_right, $height + $margin_top + $margin_bottom);
 
$org_x = $margin_left;
$org_y = $height + $margin_top;
 
//色
$bg_color   = imagecolorallocate($image, 10, 10, 10);       //背景
$line_color = imagecolorallocate($image, 255, 255, 255);    //線
$bar_color  = imagecolorallocate($image, 100, 180, 255);
$grid_color = imagecolorallocate($image, 50, 50, 50);       //
$font_color = imagecolorallocate($image, 255, 160, 200);
$grid_spacing = $height / $max * $step;
 
imagefill($image, 0, 0, $bg_color);
 
for($i=0;$i<=floor($max / $step);$i++){
    if($i !== 0) imageline($image, $org_x, $org_y - $grid_spacing * $i, $org_x + $width, $org_y - $grid_spacing * $i, $grid_color);
 
    $text = $i * $step;
    $box = imagettfbbox($font_size, 0, $font, $text);
    $text_width = $box[2] - $box[6];
    $text_height = $box[3] - $box[7];
     
    $text_x = $org_x - $font_size;
    $text_y = $org_y - $grid_spacing * $i;
    imagettftext($image, $font_size, 0, (-1 * $text_width) + $text_x, ($text_height / 2) + $text_y, $line_color, $font, $text);
}
 
$count = count($values);
$bar_spacing = floor( ($width - $bar_width) / $count);
 
for($i=0;$i<$count;$i++){
    $bar_x = $org_x + $bar_spacing * ($i + 1) - ($bar_spacing / 2);
    $bar_y = $org_y - $height * $values[$i] / $max;
 
    imagefilledrectangle($image, $bar_x, $org_y, $bar_x + $bar_width, $bar_y, $bar_color);
 
    $text = $labels[$i];
    $box = imagettfbbox($font_size, 0, $font, $text);
    $text_width = $box[2] - $box[6];
    $text_height = $box[3] - $box[7];
     
    if($label_rotate){
        $text_x = round(($text_height / 2) + ($bar_width / 2)) + $bar_x;
        $text_y = $text_width + $org_y + $font_size;
        imagettftext($image, $font_size, 90, $text_x, $text_y, $line_color, $font, $text);
    } else {
        $text_x = round((-1 * $text_width / 2) + ($bar_width / 2)) + $bar_x;
        $text_y = ($text_height / 2) + $org_y + $font_size * 2;
        imagettftext($image, $font_size, 0, $text_x, $text_y, $line_color, $font, $text);
    }
}
 
imageline($image, $org_x, $org_y, $org_x, $margin_top, $line_color);
imageline($image, $org_x, $org_y, $org_x + $width, $org_y, $line_color);
 
$box = imagettfbbox($font_size, 0, $font, $title);
$text_width  = $box[2] - $box[6];
$text_height = $box[3] - $box[7];
$text_x = $org_x + $width / 2 - ($text_width / 2);
$text_y = $org_y - $height - $font_size * 2;
imagettftext($image, $font_size, 0, $text_x, $text_y, $line_color, $font, $title);
 
header("Content-type: image/png");
imagepng($image);
 
imagedestroy($image);

今回もフォントには MigMix を用いました。
同じディレクトリにアップロードして下さい。

MigMix フォント
http://mix-mplus-ipa.sourceforge.jp/

棒グラフの間隔が狭くてラベルを表示する場所が足りない場合は $label_rotate を true にすることで、文字を縦にすることができるようにしました。
グラフ領域の上下左右の余白は margin として設定できます。ラベルや目盛を表示できるように余白を確保して下さい。